What Every Seller Should Know About Home Prices

If you’re trying to decide whether or not to sell your house, recent headlines about home prices may be top of mind. And if those stories have you wondering what that means for your home’s value, here’s what you really need to know.
It’s possible you’ve seen news stories mentioning a drop in home values or home price depreciation, but it’s important to remember those headlines are designed to make a big impression in just a few words. But what headlines aren’t always great at is painting the full picture.
While home prices are down slightly month-over-month in some markets, it’s also true that home values are up nationally on a year-over-year basis. The graph below uses the latest data from S&P Case-Shiller to help tell the story of what’s actually happening in the housing market today:
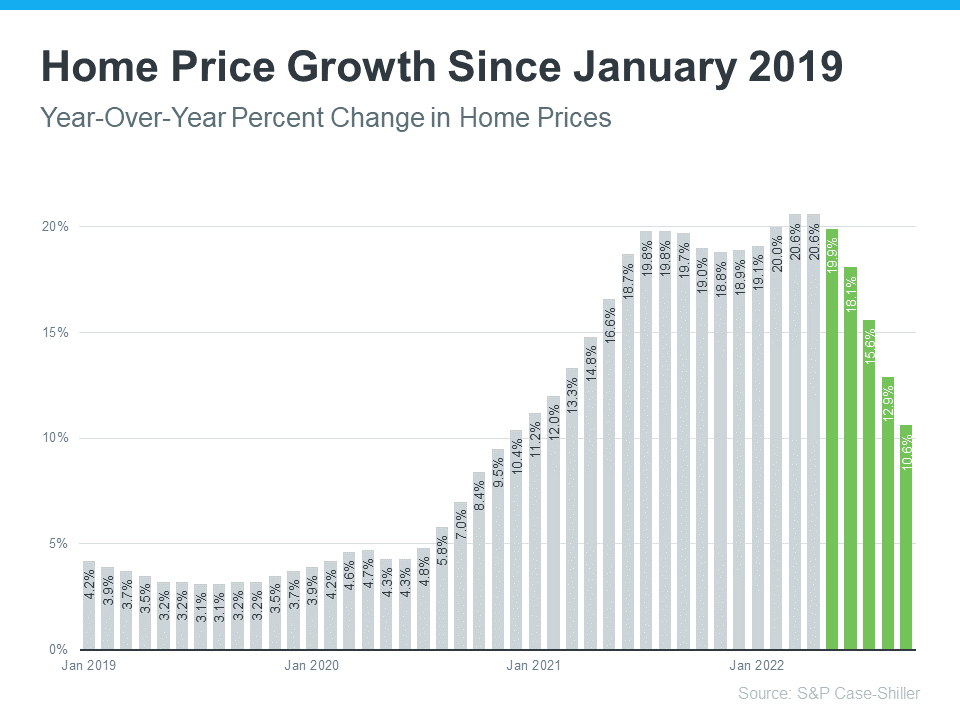
As the graph shows, it’s true home price growth has moderated in recent months (shown in green) as buyer demand has pulled back in response to higher mortgage rates. This is what the headlines are drawing attention to today.
But what’s important to notice is the bigger, longer-term picture. While home price growth is moderating month-over-month, the percent of appreciation year-over-year is still well above the home price change we saw during more normal years in the market.
The bars for January 2019 through mid-2020 show home price appreciation around 3-4% a year was more typical (see bars for January 2019 through mid-2020). But even the latest data for this year shows prices have still climbed by roughly 10% over last year.
While you may not be able to capitalize on the 20% appreciation we saw in early 2022, in most markets your home’s value, on average, is up 10% over last year – and a 10% gain is still dramatic compared to a more normal level of appreciation (3-4%).
The big takeaway? Don’t let the headlines get in the way of your plans to sell. Over the past two years alone, you’ve likely gained a substantial amount of equity in your home as home prices climbed. Even though home price moderation will vary by market moving forward, you can still use the boost your equity got to help power your move.
As Mark Fleming, Chief Economist at First American, says:
“Potential home sellers gained significant amounts of equity over the pandemic, so even as affordability-constrained buyer demand spurs price declines in some markets, potential sellers are unlikely to lose all that they have gained.”
If you have questions about home prices or how much equity you have in your current home, let’s connect so you have an expert’s advice.
Stay up to date on the latest real estate trends.

David's East Bay experience, creativity, and dedication to his clients made him a perfect fit for Elevation Real Estate

San Francisco's single-family home market continues to reach new heights, with the median sale price climbing 22.56% year-over-year to $2,200,000. This marks one of th… Read more

Prices are on the rise across the board, with single-family homes and condos both posting year-over-year gains for the first time in over a year.
Median sale prices continue their remarkable ascent, with single-family homes up more than 21% and condos up more than 18% year-over-year.
After several months of relative stability, single-family home prices in the East Bay showed some softening in April.

May 9th | 10AM - 1PM | 4 Norwich Street, San Francisco
Median sale prices are soaring in San Francisco, with condos up more than 27% and single-family homes up more than 18% year-over-year. Inventory levels remain more tha… Read more
Single-family homes are selling at a blistering pace, with the average listing moving in under two weeks.

February brought extraordinary price appreciation to San Francisco, with both single-family homes and condos posting impressive year-over-year gains. Single-family hom… Read more
You’ve got questions and we can’t wait to answer them.