Homebuyers Are Still More Active Than Usual
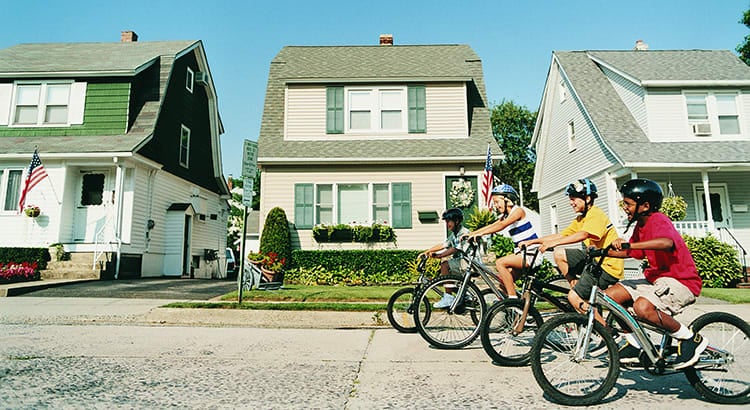
Even though the housing market is no longer experiencing the frenzy that was so characteristic of the last couple of years, it doesn’t mean today’s market is at a standstill. In actuality, buyer traffic is still strong today.
The ShowingTime Showing Index is a measure of how much buyers are touring homes. The graph below uses that index to illustrate buyer activity trends over time to help put today into the proper perspective.

It shows there’s seasonality in real estate. If you look at the last normal years in the market (shown in gray), there was a consistent pattern as buyer activity peaked in the first half of each year (during the peak homebuying season in the spring) and slowed as each year came to a close.
When the pandemic hit in March of 2020, that trend was disrupted as the market responded to the resulting uncertainty (shown in blue in the middle). From there, we entered the ‘unicorn’ years of housing (shown in pink). This is when mortgage rates were record-low and buyer demand was sky high. Similar seasonal trends still existed even during that time, just at much higher levels.
Now, let’s look at 2023. Traffic is down from the previous month and it’s also lower than the peaks we saw in the ‘unicorn’ years. But what’s happening isn’t a steep drop off in demand – it’s a slow return toward more normal seasonality. As the ShowingTime report explains:
“Showing traffic declined about 10% in May . . . This follows a typical seasonal pattern – disrupted by the pandemic but now beginning to return . . .”
And, to highlight this isn’t a drastic decline, let’s zoom in. Here’s a graph using just the May data for the last five years. It shows just how strong buyer demand still is.

Buyers are still out there touring homes. They’re more active than they were in May 2022 (when sticker shock over higher mortgage rates started to set in) and certainly more than they were in the last normal years. So, remember, buyer activity is still strong. And it could actually be even stronger if it wasn’t constrained by the limited supply of homes for sale. According to U.S. News:
“Housing markets have cooled slightly, but demand hasn’t disappeared, and in many places remains strong largely due to the shortage of homes on the market.”
Don’t lose sight of just how active the market still is today. If your house isn’t on the market, it’s not getting in front of all those buyers who are looking to make a purchase right now. Let’s connect to start the process.
Stay up to date on the latest real estate trends.

May 9th | 10AM - 1PM | 4 Norwich Street, San Francisco

Median sale prices are soaring in San Francisco, with condos up more than 27% and single-family homes up more than 18% year-over-year. Inventory levels remain more tha… Read more

Single-family homes are selling at a blistering pace, with the average listing moving in under two weeks.

February brought extraordinary price appreciation to San Francisco, with both single-family homes and condos posting impressive year-over-year gains. Single-family hom… Read more
Single-family home prices in Alameda County bounced back to $1.3 million, while condo prices remain mixed with a notable rebound in Contra Costa County.

Interview with Eddie O'Sullivan, Founder/Realtor of Elevation Real Estate
Single-family home prices surged by more than 16% year-over-year, marking one of the strongest January performances in recent memory.
Single-family home prices posted modest year-over-year gains across both counties, while the condo market continued to slide with double-digit declines in Contra Costa… Read more
The San Francisco housing market closed out 2025 with impressive year-over-year gains in median sale prices. Single-family homes saw an 8.63% increase, with the median… Read more
You’ve got questions and we can’t wait to answer them.